
Learn How to Use the RSI Indicator For Profitable Trading
Learn How to Use the RSI Indicator


Visit dipprofit.com today for the best educational trading guides.
RSI Indicator Trading Bible For Beginners
Somewhere out there right now, a trader is staring at an RSI Indicator reading of 72 and preparing to short a market that will go on to rally another 300 pips. I’ve watched it happen thousands of times. This guide exists to make sure you’re never that trader covering everything from raw basics to the exact EUR/USD and XAU/USD setups playing out on charts right now in April 2026.
The Uncomfortable Truth: “RSI below 30? Buy. RSI above 70? Sell.” I’d wager that line alone, repeated across a thousand YouTube videos and Telegram groups, has cost retail traders more money than every scam broker combined. If it worked that simply, you’d be rich already. It doesn’t. And sticking with this guide from start to finish is the fastest way I know to permanently break that habit and replace it with something that actually holds up under real market conditions.
What the RSI Indicator Actually Is And Where Most Traders Go Wrong Immediately
J. Welles Wilder Jr. introduced the RSI indicator in 1978 in a book titled New Concepts in Technical Trading Systems, which, at the time, was genuinely revolutionary. Wilder built the RSI Indicator to do one specific thing: measure momentum. Not value. Not fair price. Just the raw, mathematical speed of recent price movement. That’s it. And somehow, it’s been forty-seven years since an entire generation of retail traders turned it into something Wilder never intended it to be, a crystal ball for predicting reversals.
That gap between what RSI actually is and what people think it is is where fortunes get lost. The moment you start treating it as a price valuation tool, you’re fighting the market with the wrong weapon. The indicator isn’t broken. The mental model you’ve been sold is.
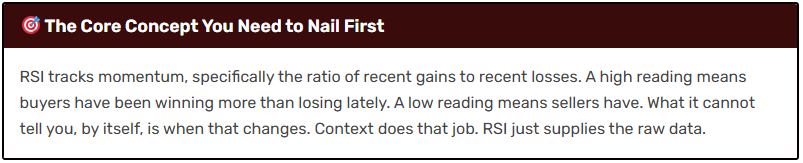
The RSI prints between 0 and 100. Wilder set 70 and 30 as his reference lines; he called them overbought and oversold, while 50 sits in the middle as a kind of neutral zone. But here’s where people go sideways: a reading above 70 doesn’t mean “the market’s expensive, time to sell.” What it actually means is that buying pressure has been consistently dominant over the last 14 candles. That’s all. Whether that buying pressure continues or exhausts is a completely separate question, one that requires context, not just a number. Momentum strength and reversal signal are not the same thing. Keeping those two ideas separated in your head is, genuinely, half the battle.
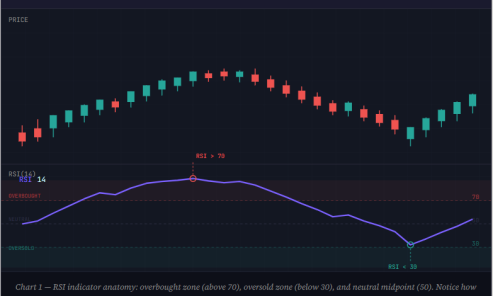
Trace that RSI line through the chart above and watch what it mirrors. As the green candles stack up and price pushes higher, RSI climbs past 50, past 60, into the 70s. Once the selling takes hold and red candles start printing, RSI drops with them through 50, toward 40, testing 30. Then, when buyers reassert, RSI turns back up. That cycle is the heartbeat of the indicator. Once you’ve genuinely internalize it, you’ll never look at RSI the same way again.
The RSI Formula: Three Minutes That Will Change How You Read This Indicator
Stick with me here for a minute. I know math isn’t why you opened this guide. But I’ve watched traders waste years fighting RSI signals they didn’t understand because they never bothered to look under the hood. Three minutes of attention here will pay back every single time you read this indicator going forward.
The formula is simpler than you’d expect. Wilder built RSI around one core idea: compare the average size of winning candles against losing candles over a rolling window (14 periods by default). Here’s how that actually works:
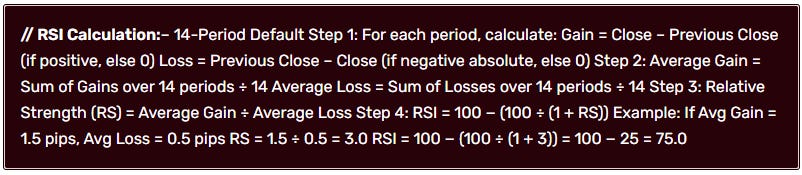
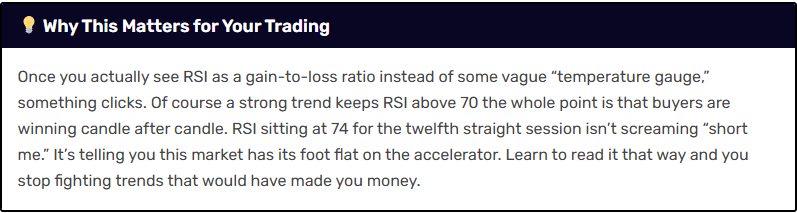
So what does RSI 75 actually mean? It means that over the previous 14 candles, the average up-move was three times bigger than the average down-move. Three times. That’s a market where buyers aren’t just winning, they’re dominating. Now, whether that domination lasts another day or exhausts itself in the next candle is something the formula genuinely cannot tell you. That’s where you have to bring in chart structure, higher timeframes, and a bit of experience.
How to Actually Read RSI: Five Things to Look At, Not Just One
Getting to this point of the article means you find it useful and I really appreciate that, to continue reading, kindly read the full article here as the article is lengthy and there is still a lot to learn. You can also visit https://www.dipprofit.com/rsi-indicator-trading-guide-from-beginner-to-pro/ to read the complete article.
You can also drop a comment and like if you find this article useful. Thanks and have a great trading experience.